
Pub Labour Math Nobody Checks
Why most pub kitchens are running at structural loss during their busiest service of the week, and the two numbers that prove it.

🎧 Beyond the Pass — Operator Podcast (1:38)
The Busy-But-Broke Trap: Fixing Your Pub with Labour Density
Prefer reading? The full breakdown is below.
A 64-cover village pub in Yorkshire. Sunday lunch service. Booked solid for nine months straight.
The owner told me Sundays were “the day that pays for the week.”
I asked him how much profit his Sunday actually made.
He went quiet.
He had the booking sheets, the till totals, the wage slips. What he didn’t have was the calculation that would tell him whether his busiest service of the week was earning money or losing it. Three weeks later, when we ran the numbers properly, the answer turned out to be uncomfortable.
Sunday was the least profitable service of his week. By a long way.
This is the most common diagnostic blind spot I see in UK pubs. Operators benchmark service quality, ticket times, and table turn. They almost never benchmark labour density. And labour density is the only number that tells you whether a busy service is profitable or just expensive.
The number nobody pulls
Pub operators track labour as a percentage of revenue. That’s the standard. 28%, 32%, 35%, depending on the model.
The problem is that labour percentage tells you almost nothing about whether the service was efficient.
A Sunday lunch can hit 28% labour and lose money. A quiet Tuesday can hit 38% labour and contribute properly. The percentage is a ratio, not a productivity measure. Two pubs with identical labour percentages can have completely different operational economics.
The number that actually matters is covers per kitchen hour.
Take your total covers for a service. Divide by total kitchen hours worked, including prep. That’s your labour density. It tells you, in one figure, how much output your kitchen produced for the labour it consumed.
Most UK pub kitchens run between 1.4 and 2.6 covers per kitchen hour, depending on the menu and service style. Below 1.8, the kitchen is structurally inefficient. Above 2.4, it’s running close to capacity. And the number that surprises operators most is that their busiest service of the week is often the one with the lowest density.
Why busy services produce weak density
The Yorkshire pub’s Sunday looked like this:
78 covers across the service
5 kitchen staff
8.5 hours each (including the 11am pre-service block)
42.5 total kitchen hours
That’s 1.83 covers per kitchen hour. Marginal at best. And that doesn’t include the Saturday afternoon prep block of another 12 hours, which pushed real density down to 1.43.
Sundays in pubs underperform because the menu structure forces it. Multiple roasts, all built around components that take 4 to 6 hours to prepare. Heavy plating. Long table turns because families don’t rush. And the kitchen team scaled up to handle the volume, which adds labour faster than it adds output.
The result is a busy room that feels like the engine of the week, while quietly producing the worst labour density of any service.
The 80% rule
There’s a second number worth pulling alongside density. Peak-hour utilisation.
Every pub kitchen has a maximum throughput per hour, dictated by station design, equipment, and team size. Call it your kitchen’s ceiling. If you can plate 32 covers in your peak hour at full pace, that’s your ceiling.
Now look at what your kitchen actually does during peak hour. If you’re hitting 19 covers in your peak hour against a 32-cover ceiling, you’re at 59% utilisation.
The benchmark to aim for is 80%. That’s the figure where the kitchen is genuinely working hard but not breaking. Below 70%, you’re carrying labour you don’t need. Above 90%, ticket times stretch and quality slips.
The Yorkshire pub I worked with had a peak ceiling of 28 covers. Their peak-hour throughput on a Sunday was 17. 61% utilisation on the busiest service of the week.
Translation: even on Sunday, with every table booked, the kitchen was operating well below its capacity. Not because the team was slow, but because the menu structure created prep bottlenecks that throttled service. Every plate had to wait on a component that wasn’t ready.
What density and utilisation tell you together
Density and utilisation are two sides of the same diagnostic.
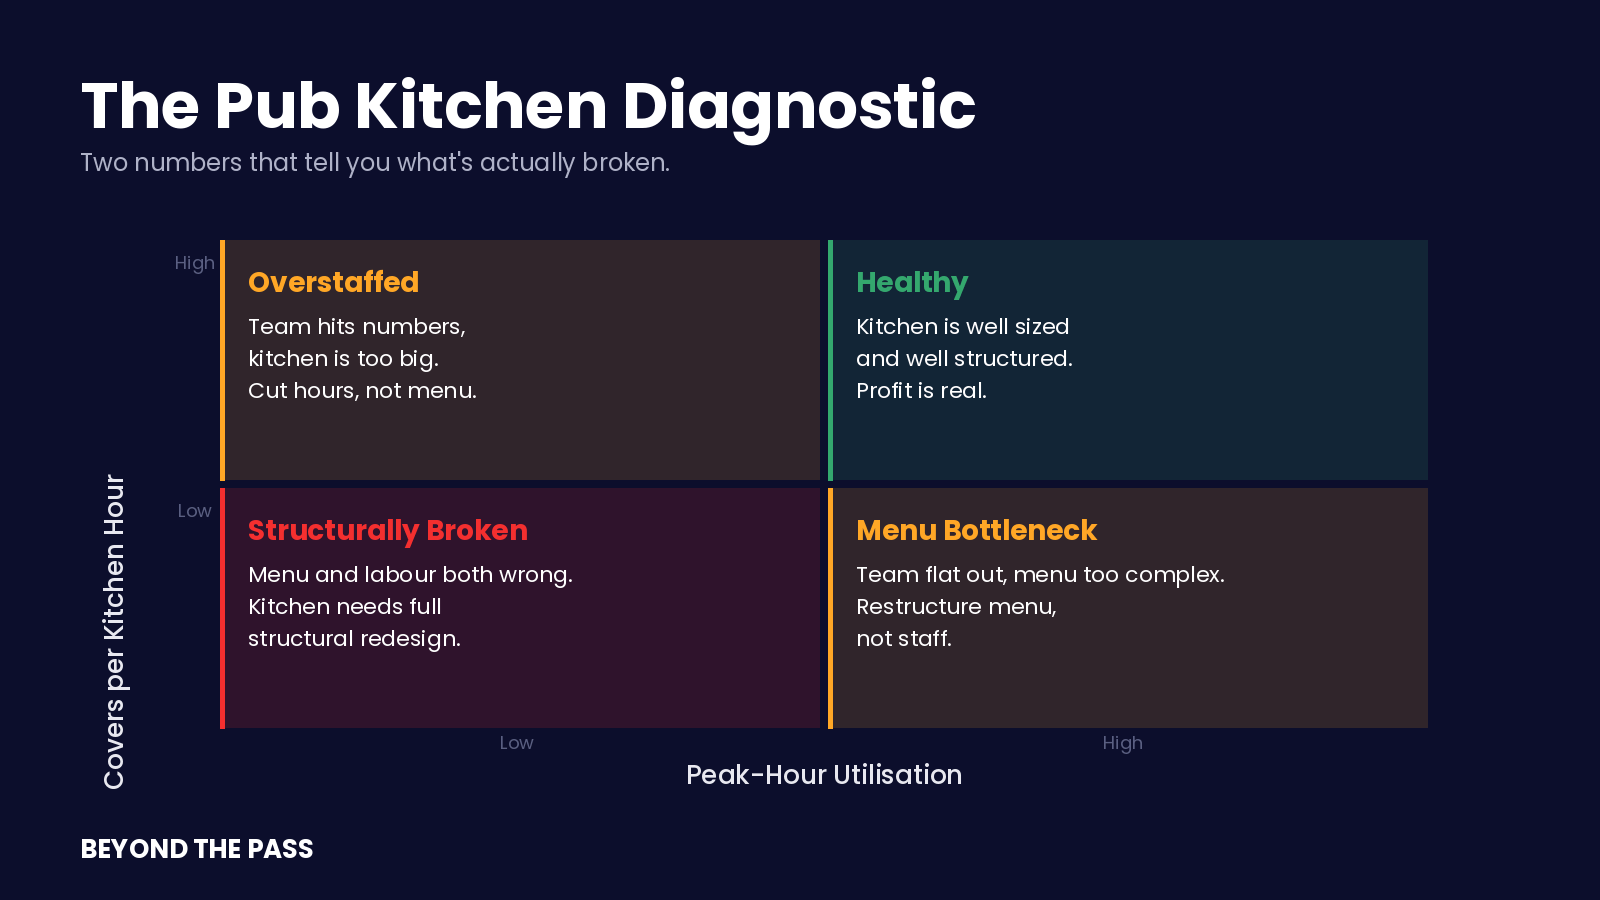
High density, high utilisation: The kitchen is well structured and well sized. Profit is real.
High density, low utilisation: Team is hitting numbers but the kitchen is overstaffed. Cut hours, not menu.
Low density, high utilisation: Team is working flat out but the menu is too complex. Restructure menu, not staff.
Low density, low utilisation: Menu and labour are both wrong. The kitchen needs structural redesign.
The Yorkshire pub fell into the third quadrant. Low density, low utilisation, on what the owner thought was his most profitable service. The diagnosis was menu structure, not headcount.
Six weeks later, after removing two of the lowest-density dishes and rebuilding the prep around three core components instead of seven, the same Sunday hit 2.4 covers per kitchen hour and 81% peak utilisation. Same staff. Same booking sheet.
The Sunday went from being the day that hid the loss to the day that earned the week.
Run this on your own pub this week
Two calculations. Twenty minutes if you have the data to hand.
Calculation 1: Covers per kitchen hour, by service.
For each service last week, take the cover count and divide by total kitchen hours worked (chefs and KP only, prep included).
Benchmarks:
Under 1.8: structurally inefficient
1.8 to 2.2: marginal
2.2 to 2.4: healthy
Above 2.4: high performance
Calculation 2: Peak-hour utilisation.
Pick your busiest hour of the busiest service. Count plates leaving the pass during that hour. Divide by your kitchen’s theoretical ceiling for that hour.
Benchmarks:
Under 70%: overstaffed for menu complexity
70% to 80%: healthy
80% to 90%: optimal
Above 90%: at risk of service breakdown
If the busiest service of your week comes back below 1.8 density and below 70% utilisation, the kitchen is losing money on the day you think is paying for everything else.
That’s not a labour problem. It’s a menu structure problem hiding inside a labour line.
Next week in the pub series: Menu size vs skill reality. Why pub menus drift to 22+ items, what the right item count actually is, and how to cut without losing the dishes that bring people in.
Free 15-minute diagnostic that surfaces these numbers automatically here.