
The Beverage Diagnostic
Three numbers and twenty minutes that tell you whether your wet side is genuinely carrying the business or just looks like it.


🎧Beyond the Pass — Operator Podcast (1:36)
Stop bar profit leaks with yield gap
Prefer reading? The full breakdown is below.
Over five posts we’ve taken apart the wet side of hospitality one belief at a time.
The bar’s beautiful gross profit that turns out to be a fraction of what it looks like. The cocktail menu with the best GP on the bar and some of the worst real margin. The wine list priced to protect a percentage while the cash walks out the door. The eight per cent leaking between the delivery door and the till, unmeasured, often equal to the entire net profit of the site. And the wet-versus-food question that gets decided on instinct when it should be decided on fixed cost.
Every one of those posts made the same argument from a different angle: the numbers that feel like they measure profit on a bar usually don’t, and the ones that do are the ones nobody calculates.
This post puts them together. Three numbers, one sitting, and an honest answer to whether your wet side is genuinely earning or simply flattering itself.
What you need before you start
Pull three things from your last full trading week. One real week, not an average.
Your wet sales, ex-VAT. Divide gross wet takings by 1.20.
Your bar labour hours and cost. Every hour of bar and floor labour attributable to wet service, with the wage cost including on-costs. Not the blended figure across the whole business. The bar’s own number, which most operators have never separated out.
Your opening stock, deliveries and closing stock for the bar. This is the one people skip. It’s also the one that produces the most useful answer.
That’s it. Now run the three calculations.
Number 1: Real wet contribution
Start with your headline wet gross profit. Most bars sit somewhere between 68% and 75%.
Now subtract the things the GP ignores.
Bar labour as a percentage of wet sales. In most operations this lands between 16% and 22%.
Wastage as a percentage of wet sales. If you’ve measured it, use your number. If you haven’t, assume 8% and you won’t be far wrong, which is itself worth sitting with.
The carrying cost of slow stock, the cash tied up in ranges that don’t turn. Rough it at 4% to 6% unless you’ve calculated it properly.
What’s left is your real contribution. Worked through on a typical set of numbers, a 72% headline GP less 19% labour, less 9% wastage, less 6% slow stock leaves roughly 38%.
Benchmarks:
Below 30%, the bar is not carrying anything. It may well be the thing being carried.
30% to 40%, the bar is contributing but well below what its headline suggests. This is where most sites land.
Above 45%, the wet side is genuinely strong. Protect whatever you’re doing.
The gap between your headline GP and this number is the single most revealing thing on your bar. Most operators find it’s half what they assumed.
Number 2: The yield gap
Take your opening stock, add deliveries, subtract closing stock. That’s what you actually used.
Now take your sales and work out what you should have used at your recipe and measure specs. The difference, expressed as a percentage of wet sales, is your yield gap.
Benchmarks:
Under 3%, tight. Genuinely well run.
3% to 6%, normal, with recoverable money in it.
6% to 10%, a serious leak. On an £8,000-a-week bar, 8% is £640 a week and roughly £33,000 a year.
Above 10%, this is the most urgent number in your business and nothing else you do this quarter will pay back as fast as fixing it.
The reason this number matters more than almost any other: recovered wastage falls to the bottom line at 100%, because the cost is already sunk. New sales only bring you the margin. A pound recovered from waste is worth more than a pound of extra revenue, and it needs no new customers, no new spend and no risk.
Number 3: The wet-food balance
This one is a comparison rather than a calculation, and it settles the argument most operators have been having with themselves for years.
Work out your kitchen’s real contribution the same way you did the bar’s. Food gross profit, less kitchen labour including prep as a percentage of food sales. On typical numbers, 69% GP less 47% labour and prep leaves around 22%.
Now put the two side by side. Real wet contribution against real food contribution.
The point isn’t to declare a winner. It’s to see how far the true gap sits from the one in your head. Operators who believe the bar contributes 72% and the kitchen 31% are working with a forty-point gap. The real one is often closer to sixteen. That difference changes what you invest in, what you cut, and which side you actually watch.
And run the counterfactual alongside it, because contribution on its own doesn’t capture everything. What share of the total bill would disappear if the kitchen closed? Compare average drinks spend on covers that ordered food against those that didn’t, and look at what wet trade does on days the kitchen is shut. A kitchen that loses money on its own line while pulling in trade that drinks well is doing a different job than its P&L suggests.
Reading the three numbers together
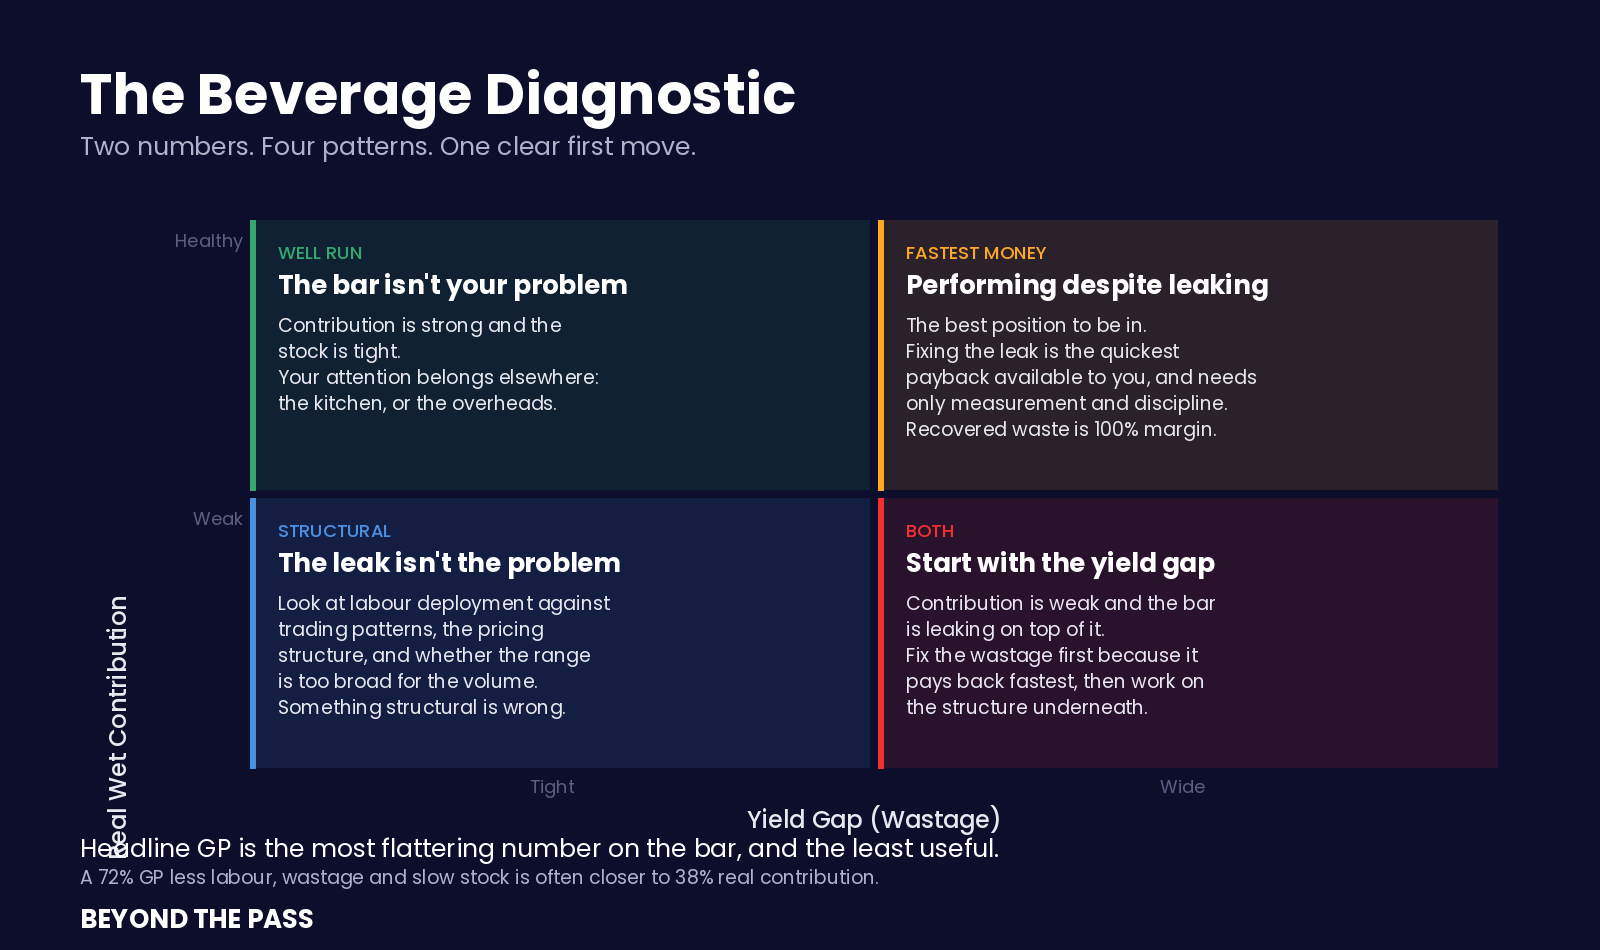
Four common patterns, and what each one means.
Real wet contribution healthy, yield gap tight. The bar is genuinely well run. Your attention belongs elsewhere in the business, most likely the kitchen or the overheads.
Real wet contribution healthy, yield gap wide. The bar is performing despite leaking. This is the best position to be in, because fixing the leak is the fastest money available to you and requires nothing but measurement and discipline.
Real wet contribution weak, yield gap tight. The leak isn’t the problem. Look at labour deployment against trading patterns, at the pricing structure, and at whether the range is too broad for the volume. Something structural is wrong, not operational.
Real wet contribution weak, yield gap wide. Both. Start with the yield gap because it pays back fastest, then work on the structure underneath.
Most operators who run these three numbers find the same thing: the bar contributes less than they believed, leaks more than they’d have guessed, and sits closer to the kitchen than any of their instincts suggested.
What the whole series comes down to
Six posts, one argument.
The wet side of hospitality is judged on the most flattering number available and managed on almost none of the useful ones. High gross profit hides thin real contribution. The best-looking drink on the menu can carry the worst economics. The wine list protects a percentage while giving away cash. And the gap between what a bar buys and what it sells is often the entire profit of the site, pouring away in measures nobody counts.
None of this is visible from the headline. All of it is recoverable once you measure.
The operators who make real money on the wet side aren’t the ones with the best GP. They’re the ones who stopped trusting the beautiful number and started measuring the harder one underneath.
Run the three numbers. Twenty minutes, one week of data, and you’ll know more about your bar than you did this morning. Whether you fix anything afterwards is up to you, but you won’t be guessing any more, and that’s the whole point.
---
That closes the bar and beverage series. Next, something more immediate: what VAT actually does to hospitality unit economics, why the twenty per cent doesn’t come out of the customer’s pocket the way most people assume, and what the current debate keeps getting wrong in both directions.
Free 15-minute diagnostic that surfaces these numbers for your own operation here.
I like the attempt to look past the beautiful GP number.
Hospitality has spent years protecting percentages that look good on paper while too little money reaches the bank.
a percentage tells us how good the margin looks. cash tells us how much REAL money is actually left.
could the bar with the weaker percentage still give more money because it sells much more?
and could the kitchen with the weaker margin still be helping the bar make more money because the drinks disappear when the food does?
perhaps relevance is measured by absence: remove one side, then see how much money disappears with it.
Durak, back again with the sharpest question in the thread. Both of those are right.
On the first: yes, and that's a gap in how I presented it. Contribution percentage isn't the endpoint, it's contribution multiplied by volume that reaches the bank. A 30% contribution on £12,000 of wet sales puts £3,600 in. A 45% contribution on £6,000 puts in £2,700. The weaker percentage wins comfortably. I ranked by percentage in the post and I should have said plainly that you rank by cash, then use the percentage to work out why the cash is what it is. The percentage diagnoses. The cash decides.
On the second: that's the better version of what I wrote, and "relevance is measured by absence" is a cleaner way to say it than anything in my piece. A kitchen can post 22% on its own line while the bar's takings only exist because people came for food. Strip the kitchen out and you don't just lose the food margin, you lose the drinks that came with it.
The awkward part is that this cuts both ways and hardly anyone tests it. Operators are quick to say the kitchen brings the drinks trade in, because it justifies keeping a kitchen that isn't paying for itself. Far fewer check whether it's actually true. The proxies I'd use are average drinks spend on covers that ordered food against those that didn't, and what wet trade genuinely does on days the kitchen is closed. If both come back flat, the kitchen isn't earning its keep through the bar either, and that's a harder conversation.
The absence test is a better organising idea than the contribution split I built the series around. That's a post rather than a comment, so I'll write it properly and credit where it came from.